 An empirical analysis conducted by MIT professors on the U.S. example concluded that wearing masks at the beginning of the pandemic could reduce average new cases and mortality by 10 percentage points. See source for empirical analysis
Mask vs Covid-19
An empirical analysis conducted by MIT professors on the U.S. example concluded that wearing masks at the beginning of the pandemic could reduce average new cases and mortality by 10 percentage points. See source for empirical analysissource:Jounal of Economtrics. 17.10.2020
published:
Normal (Gaussian) distribution
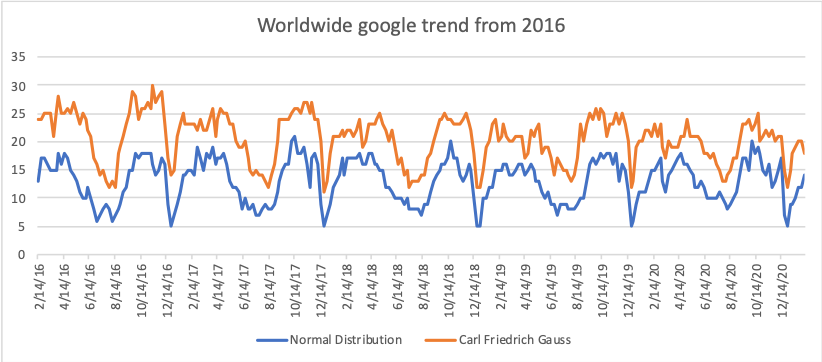 The normal distribution is the same as the Gaussian distribution. If we look at the statistics of the following words listed in the Google search engine in 2016-2020, we will see that the search terms "normal distribution" and "Karl-Friedrich Gauss distribution" were characterized by almost similar dynamics, with a close correlation between them Correlation = 0.82 At the same time, the average annual growth rate was positive during the mentioned period.
source:google trend
published:
Bestsellers in econometrics
 The role of econometrics in research activities is growing, as evidenced by the modern challenges that require a fundamental theoretical knowledge of the research object from the researcher. The following is a collection of top literature, some of which has been tried and tested in the world's leading universities and colleges as a basic and auxiliary guide.
| The title of the book | Author |
|---|---|
| • Introductory econometrics: A modern approach. Nelson Education 2015. | Jeffrey M. Wooldridge |
| • Introduction to Bayesian Econometrics 2nd Edition | Edward Greenberg |
| • Econometrics by Example 2nd Edition | Damodar Gujarati |
| • Introduction to Econometrics | Christopher Dougherty |
| • Econometric Analysis of Panel Data 5th Edition | Badi H. Baltagi |
| • Panel Data Econometrics | Donggy Sul |
| • A Primer in Econometric Theory | John Stachurski |
| • Econometrics For Dummies | Roberto Pedace |
| • Time Series Econometrics | John D.Levendis |
| • Principles of Econometrics, 5th Edition | R. Carter Hill, William E. Griffths, Guay C.Lim |
published:
Econometric software packages
 To solve econometric problems, we will introduce you to the computer programs that exist today. Most of them are based on commands, the summoning of which completes a specific task. Below is a list of top programs that stand out from each other with different features. These include: task quality, accessibility, and visual interpretation of the data
| Softwares | Web-pages |
|---|---|
| • R and RStudio | Go to the link_1,Go to the link_2 |
| • Python | Go to the link |
| • SAS | Go to the link |
| • SPSS | Go to the link |
| • MATLAB | Go to the link |
| • Eviews | Go to the link |
| • Stata | Go to the link |
| • Excel | Go to the link |
| • GAUSS | Go to the link |
| • OriginLab | Go to the link |
| • Prism | Go to the link |
| • Minitab | Go to the link |
published:
Regression analysis in Excel
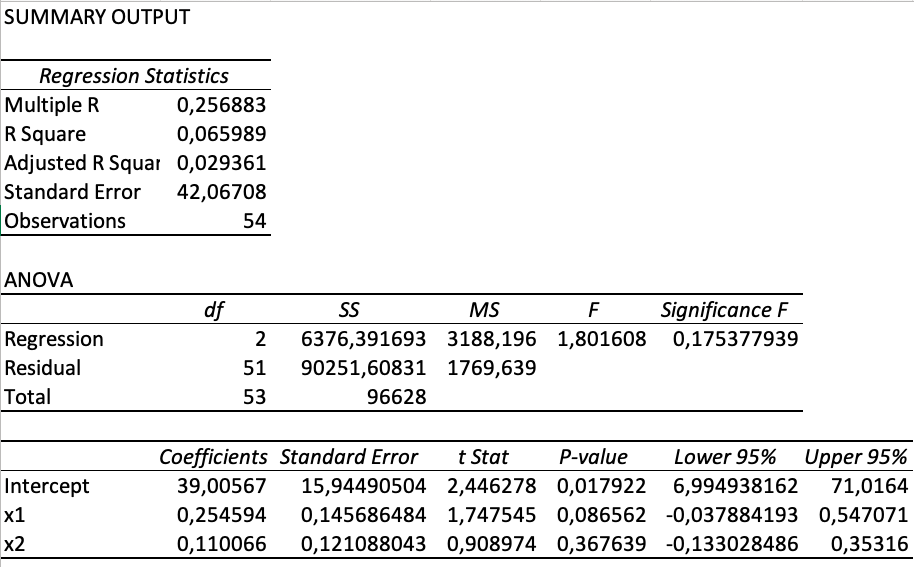 Excel is known to be the most well-known and universal program for data processing and interpretation. Excel can easily cope with this or that complex task. As for regression analysis, Excel uses the least squares method-based regression model (OLS), which instantly gives us the result field. It contains econometric indicators such as the coefficient of determination, the standard deviation of the coefficients and the rest of the basic indicators.
Enable Regression Analysis, Instructions and Explanations
Options - Analysis ToolPak - Check Analysis ToolPak
After activating Analysis ToolPak, we enter Data - Analysis - Regression
Fill in the range of independent Y and dependent X variables. Pressing the Enter button will bring up the resulting field. As shown in the photo.
| • Multiple R | Multiple correlation coefficient |
| • R Square | Determination Rate |
| • Adjusted R Square | Corrected Determination Rate |
| • Standard Error | Standard Error |
| • Observations | Observation |
| • ANOVA | Analysis of variance |
| • Regression | - |
| • Residual | - |
| • Total | - |
| • df | degrees of freedom |
| • SS | sum of squares |
| • MSS | mean square |
| • F | Fisher Statistics - MSregression / MSresidual |
| • Significance F | Significance of Regression |
| • Intercept | Free Ratio |
| • Coefficients | Regression Ratios |
| • t Stat | Student Statistics |
| • P-value | Probability that regression coefficients will match theoretical coefficients |
| • Lower 95% | Lower limit of regression coefficients |
| • Upper 95% | Upper limit of regression coefficients |
published:
AI, BI and Microsoft Power Apps.
 Microsoft is a leader in the development of artificial intelligence. You can use the modern method of data processing and interpretation, which uses artificial intelligence in the process of data analysis. Due to the fact that the activities of this or that field need a customized platform, with the help of Microsoft Power Apps it is possible to create models tailored to a specific activity in the form of applications created by the user and set the desired control panel using low-code. As for artificial intelligence AI, it is a universal way to solve this or that task in a completely computerized way. It is so important for business that Microsoft has created a Power BI (Business intelligence) program that uses artificial intelligence to visualize and process data.
published:
ML (Machine Learning) - Learn and teach
 In the world of digital industry, machine learning occupies an important place. It allows you to perform tasks for which there is only scant information. ML (Machine Learning) can create a new variable for a new function that needs to be named. Given that the algorithm actively uses part of the mathematics of probability theory, one may suspect that the result achieved by ML will also be probabilistic, but the algorithm can consider minimizing errors and continuing the process until the result is reliable and exhaustive. Because of these features, companies in the digital industry are actively trying to introduce machine learning in applications or computer programs, but it should be noted that the creation of the initial algorithm requires a thorough knowledge of mathematics, because all information is translated into computer language and vice versa computer gives us new variables Resource. The latter gives us a very important result about this or that event.
published:
Econometric Society Online
 The popularization of econometric research has been actively led by the econometric community since the last century. www.econometricsociety.org organizes meetings, publishes journals, and allows researchers to share the results of their research with the general public. It should be noted that the economic community has special prizes in various nominations, which are awarded to the author of the best paper.
published:
Nobel Prize 1901 - 2020
 The share of Nobel Prize winners in the field of economics is small compared to other fields. In 1901-2020, it accounted for only 9% of the total prize nominations. As for the natural sciences, the number of prize-winners in the mentioned period reached 37% in total. It should be noted that the Nobel Prize in Economics is quite difficult to earn, because a particular scientific paper with all the academic criteria must fit into real life and it must have universal benefits for future generations, such an innovation can be any economic model that solves social issues such as unemployment high level.
published:
BLUE Estimator
 To make a valid conclusion during the regression analysis, it is necessary for the model to satisfy the Gauss-Markov assumptions, which are shown in the table below. If these assumptions are met, then the model rated by OLS (ordinary least squares) will be most optimal. Hence the acronym BLUE (Best Linear Unbiased Estimator) corresponds to a given position, also known as the Gauss-Markov theorem.
| assumptions | i = 1,2, . . . , n and j = 1,2,. . . , m |
|---|---|
| 1. The model is linear and the random member is independent of the explanatory variables | Y = ꞵ0 + ꞵ1X1 + ꞵ2X2 + . . . + ꞵmXm |
| 2. the mean of random member equal to zero | E(ui) = 0 |
| 3. Independent variables and random member are uncorrelated | cov(ui,xj) = 0 |
| 4. Random member variation matches theoretical variation | D(ui) = 𝛔2(u) |
| 5. Random members are independent of each other | E(uqup) = 0 , q ≠ p |
| 6. The rank of the independent variable matrix corresponds to the number of its columns and is less than the number of observations | r(X) = m+1 < n |
| 7. Random member is normally distributed | Ui ~ N(0, 𝛔2(u)) |
published: